← Work / Case Study · Financial Services

Four system categories.
One warehouse.

A production-grade credit union data warehouse deployed on Azure — built around the four data systems every institution runs, unified with dbt, and surfaced as live executive dashboards with campaign targeting. Modeled on a ~$1B portfolio. Architecture scales to any cloud.

Industry Credit Unions · Financial Services
Scope Data Warehouse · Analytics Engineering
Cloud AWS · Azure · On-premises
System categories
Core Banking Consumer Lending Mortgage Servicing Originations
This POC — live on Azure
dbt Azure SQL Azure Blob Data Factory Metabase Python
Production
Snowflake Databricks Azure AWS Power BI
4 Source systems integrated
36 dbt models — stg → int → dw → mart
58 Automated data quality tests, all green
~$950M Synthetic portfolio — calibrated for a $1B credit union
The problem

The data that runs your institution lives in separate systems that don't talk

Every credit union runs the same categories of system — core banking, consumer lending, mortgage servicing, and originations. The vendors differ. The problem doesn't.

The CFO's delinquency report is pulled manually every Monday. The CLO can't see approval rates by DTI band without querying the origination platform. The CRO doesn't know which branch has the highest charge-off concentration. The CMO can't see product penetration without a data request.

When every answer requires a different login, the answer to every question is "let me check."

The solution

One warehouse. Three numbers your CFO needs every morning.

We connect all four system categories into a single warehouse — on whatever cloud you run, with whatever source systems you have. We built a star schema with dbt, automated data quality tests, and surfaced five executive dashboards calibrated for each audience.

Portfolio balance, delinquency rate, and charge-off rate are always current. The CLO sees DTI distribution by channel. The CRO has a roll rate matrix. The CMO sees product penetration by member type. Marketing gets campaign-ready target lists — auto refi opportunities, cross-sell candidates, and early-stage delinquency outreach — all driven by the same warehouse.

A specialist team handles the work end to end: data engineering builds the pipeline, a QA analyst runs the test suite, and a security reviewer audits credentials, encryption, and access before anything goes live. The dbt models are cloud-portable by design — this POC runs on Azure SQL today and deploys to Snowflake, Databricks, or Fabric with a one-line profile change.

Architecture

Five layers. Full lineage.

Scroll horizontally to explore →
Core Banking Keystone · Symitar · DNA Jack Henry · Temenos Consumer Lending MeridianLink · nCino Temenos · Finastra Mortgage Servicing FICS · MSP · LoanServ Black Knight · ServiceMac Originations MortgageBot · Encompass Blue Sage · Blend raw.* 22 tables · CSV → Blob → ADF → Azure SQL · untyped (all_varchar) stg.* views 16 models · typed + renamed · semi-structured parsing · SCD2 flags preserved int.* views 3 models · SCD2 resolved · member + account spines unified · applications normalized dw.* Star schema · 5 dims + 2 facts 1.5M daily snapshot rows mart.* 9 aggregation models · 58 automated tests includes 3 campaign targeting models BI CFO CLO CRO CMO
Live on Azure

Not hypothetical. Deployed and running.

This POC is live on Azure today — Azure SQL Database for the warehouse, Azure Blob Storage as the CSV landing zone, Azure Data Factory for automated ingestion, and Metabase on Azure Container Instances for dashboards. Total cost: ~$1.50/day on a free trial. The same dbt models deploy to Fabric, Snowflake, or Databricks with a one-line profile change.

This POC
Production on Azure
Ingestion Azure Data Factory LIVE ForEach pipeline — Blob CSV → Azure SQL, parameterized per table
Ingestion Azure Data Factory SAME Add scheduled triggers, retry logic, lineage in Microsoft Purview
Storage Azure SQL + Blob Storage Basic tier (5 DTU) · 23 CSVs in Blob landing zone · TLS 1.2
Storage Fabric Lakehouse · Synapse Delta Parquet on OneLake — same schema names, cloud-scale
Transformation dbt-sqlserver LIVE 36 models · 58 tests · staging → mart lineage · env_var() credentials
Transformation dbt-fabric UNCHANGED Same 36 models, same 58 tests — one line change in profiles.yml
Visualization Metabase on ACI 5 dashboards · 33 cards · native SQL queries against Azure SQL
Visualization Power BI — DirectLake Row-level security, scheduled refresh, embedded in Teams
Already on Azure
  • Azure Data Factory — ForEach pipeline, Blob → SQL, parameterized datasets
  • Azure SQL Database — 36 dbt models, 58 tests, TDE encryption enabled
  • Azure Blob Storage — CSV landing zone, TLS 1.2, 23 source files
  • Metabase on ACI — 5 dashboards including campaign targeting
  • Security hardened — env_var() credentials, .gitignore, no plaintext secrets
Upgrade path
  • Azure SQL Basic → Fabric Lakehouse or Synapse for production scale
  • Metabase → Power BI with DirectLake — sub-second queries, row-level security
  • dbt-sqlserver → dbt-fabric adapter (one line in profiles.yml)
  • Manual ADF triggers → scheduled nightly pipelines with alerting
Added in production
  • Row-level security in Power BI — branch managers see only their branch
  • Scheduled refresh — nightly pipeline, morning dashboards ready at open
  • Teams embedding — dashboards surface inside Teams channels, no separate login
  • Microsoft Purview — column-level lineage from source CSV to Power BI visual
Compatibility

Works with your stack — whatever it is.

This POC runs live on Azure SQL with Metabase dashboards and ADF pipelines. In production we deploy on whatever cloud and tooling your institution already runs.

Core Banking
  • Keystone / Corelation
  • Symitar / Jack Henry
  • DNA / Fiserv
  • Temenos
  • Open Solutions
Lending & Originations
  • MeridianLink
  • nCino
  • MortgageBot / Finastra
  • Encompass / ICE
  • Blend · Blue Sage
Mortgage Servicing
  • FICS
  • MSP / Black Knight
  • LoanServ
  • ServiceMac
  • Sagent
Cloud & Warehouse
  • AWS · Azure · GCP
  • Snowflake
  • Databricks
  • Microsoft Fabric
  • Redshift · BigQuery
Dashboards

One pipeline. The right view for every stakeholder.
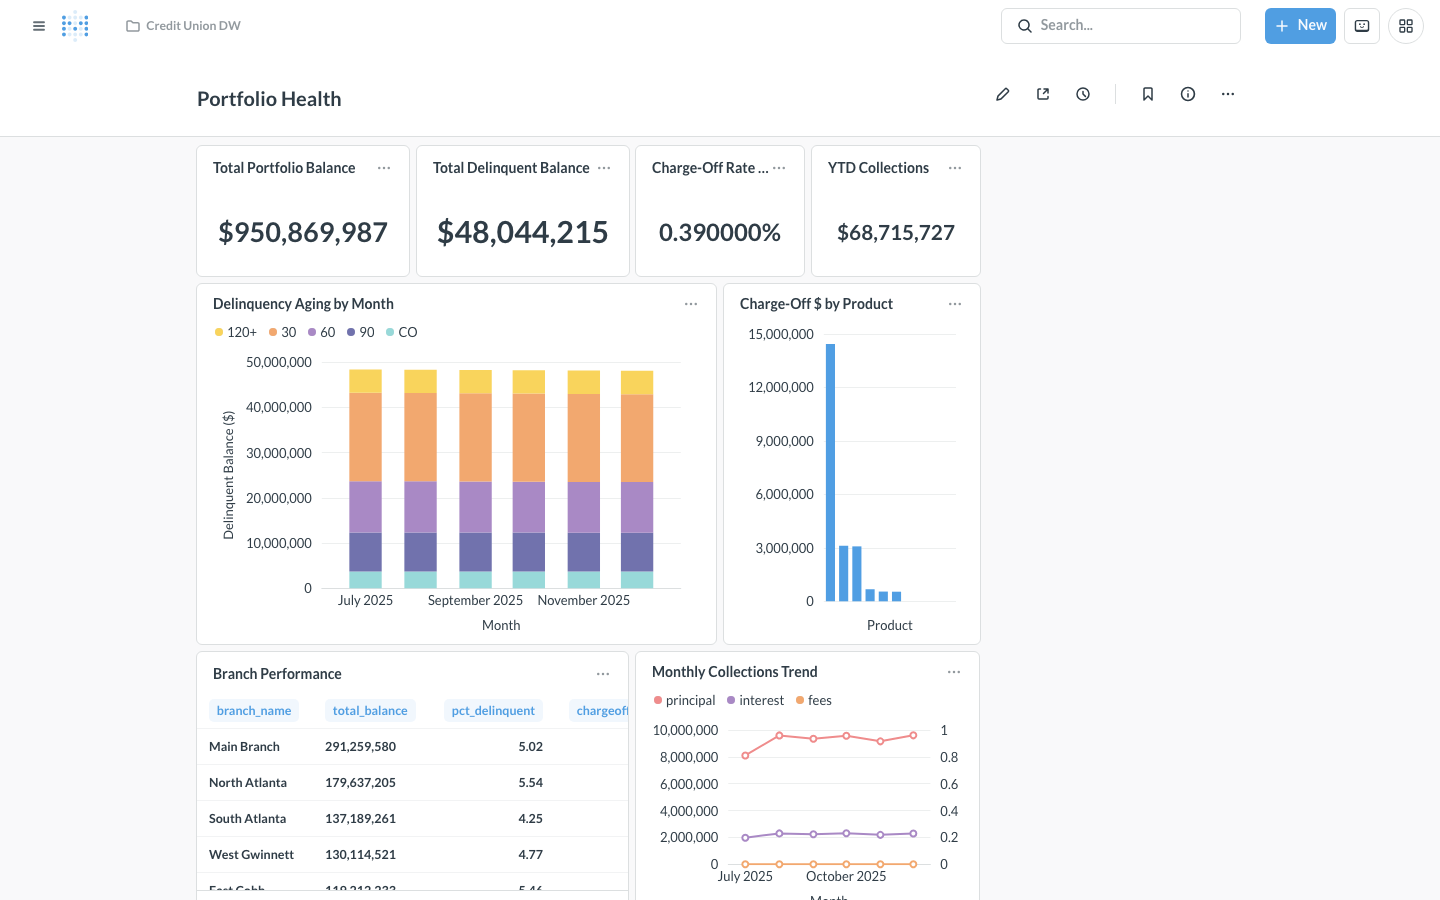
Portfolio Health dashboard — total balance, delinquency aging, charge-off by product, branch performance table
CFO · Portfolio Health
Total balance, delinquency aging, charge-off by product

Four KPI cards, a monthly delinquency rate trend, stacked aging chart by DPD bucket, charge-off ranked bar, and branch performance table with color-scaled risk indicators.

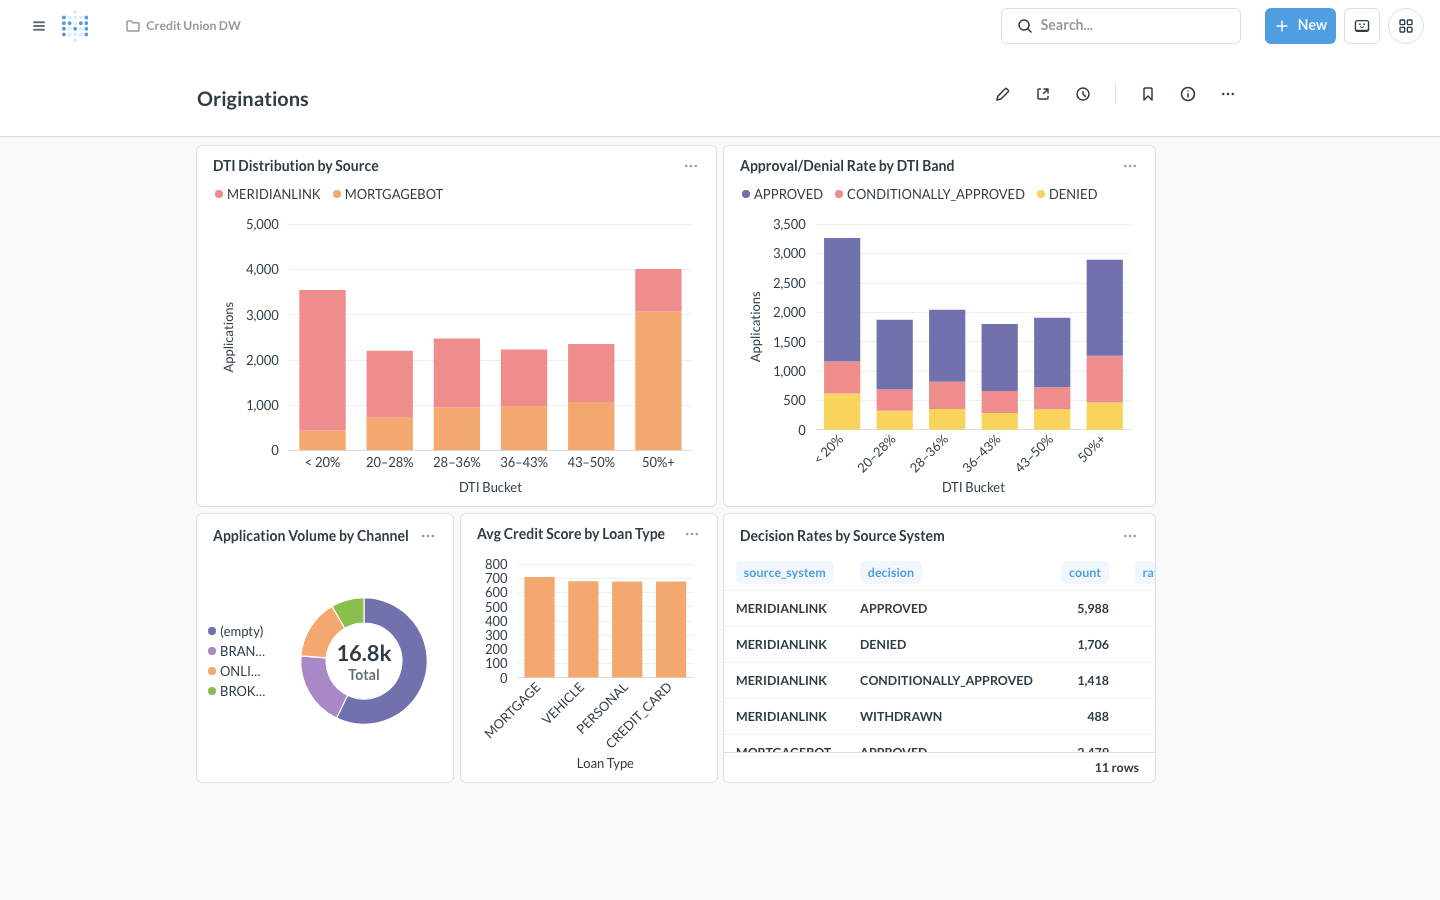
Originations dashboard — DTI distribution, approval rates, credit score by product, YTD collections
CLO · Originations & Lending
DTI distribution, approval rates, monthly collections

Application volume by DTI band across MeridianLink (consumer) and MortgageBot (mortgage). Stacked 100% decision chart. Credit score by risk tier. YTD collections by product type.

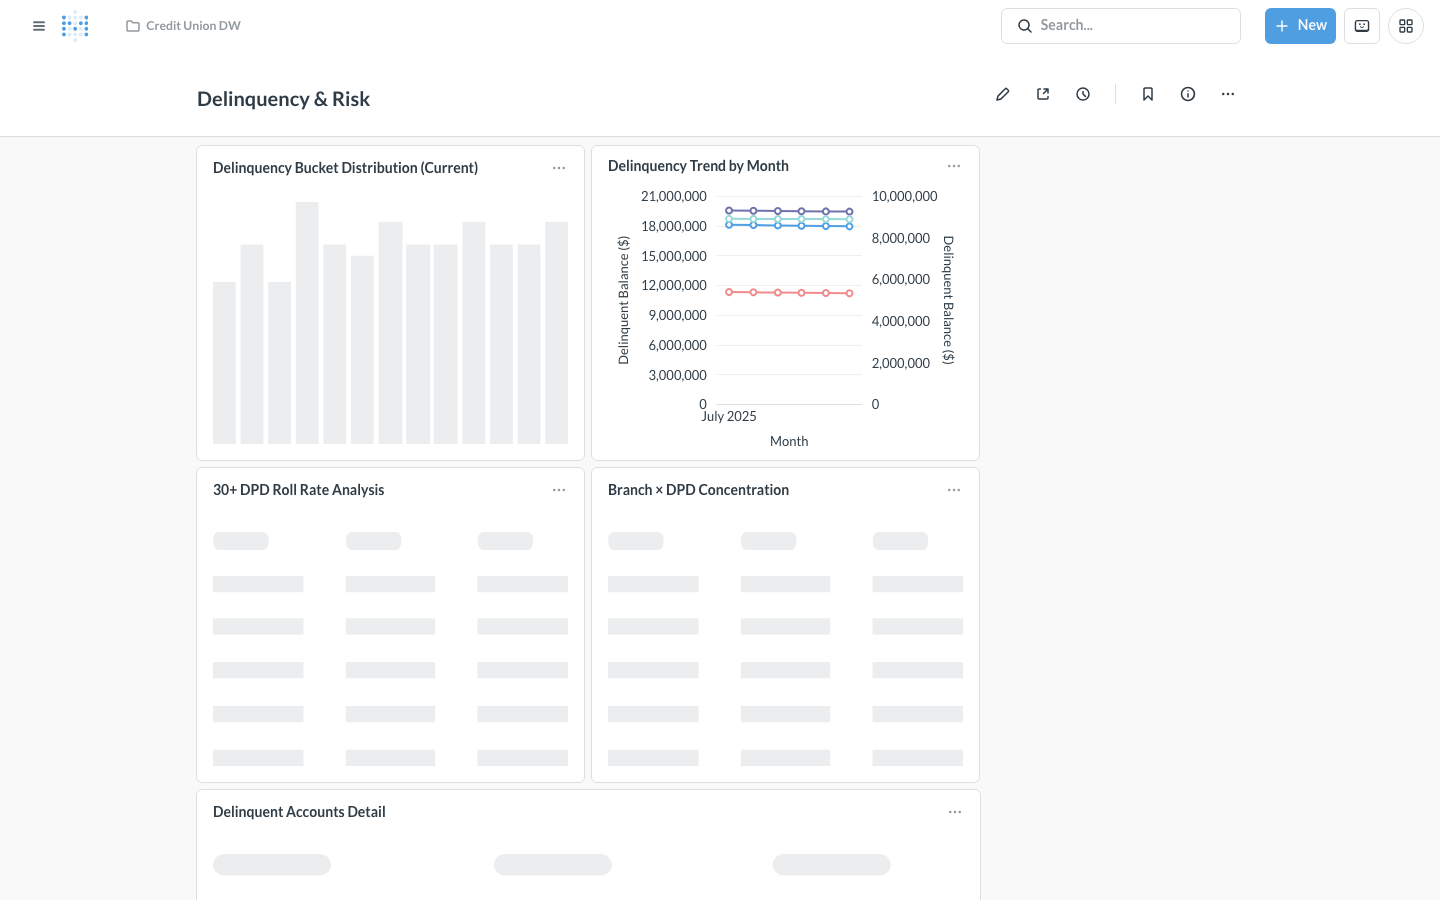
Delinquency and Risk dashboard — DPD bucket migration, roll rate matrix, branch charge-off
CRO · Delinquency & Risk
DPD migration, roll rate matrix, branch charge-off

Account count stacked bar by DPD bucket per month. Area chart by severity. Roll rate matrix — the standard input for CECL loan loss reserve models under NCUA supervision.

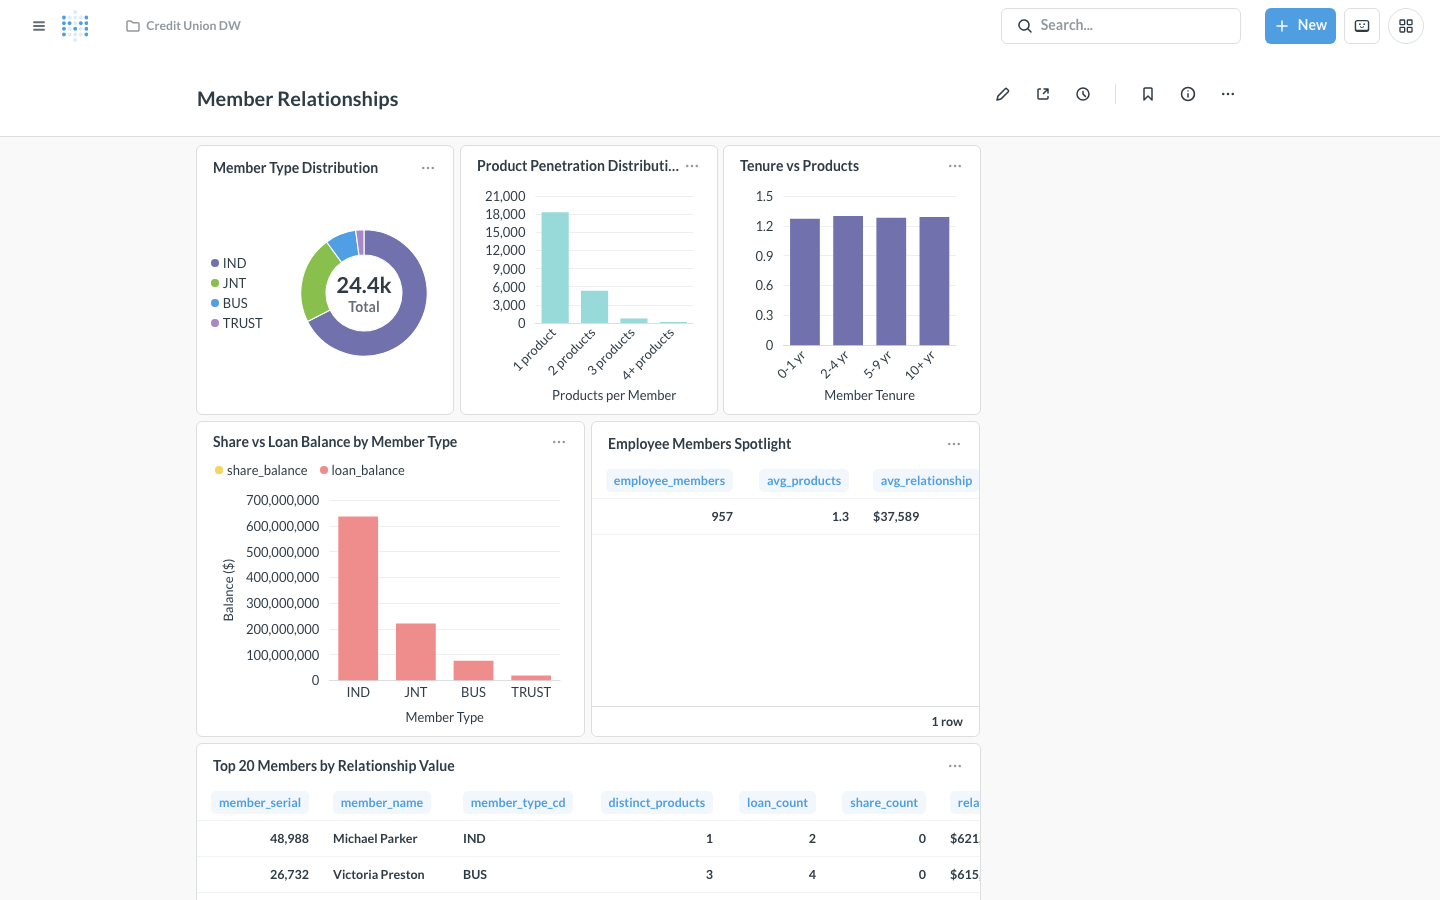
Member Relationships dashboard — membership composition, product penetration, employee members
CMO · Member Relationships
Member segments, product penetration, employee members

Membership composition by IND/JNT/BUS/TRUST. Average relationship value by type. Product penetration histogram. Employee member segment with rate exception reporting context.

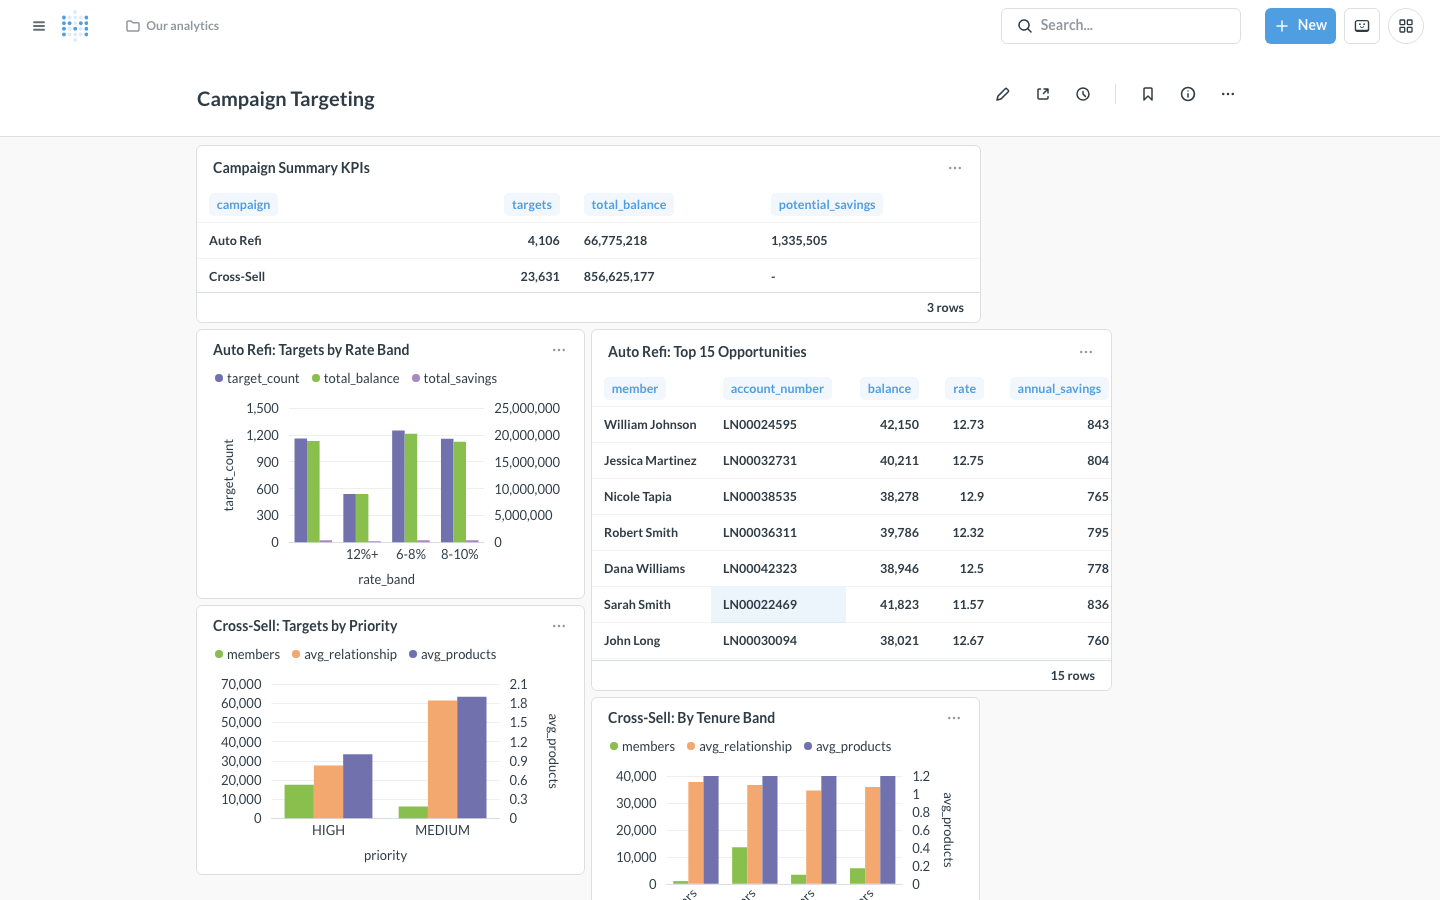
Campaign Targeting dashboard — auto refi, cross-sell, delinquency outreach targets
Marketing · Campaign Targeting
Auto refi, cross-sell, and delinquency outreach targets

4,106 auto refi targets by rate band. 23,631 cross-sell candidates prioritized by tenure and product gaps. 1,008 early-stage delinquent accounts with recommended outreach actions. Exportable target lists for every campaign.

Domain depth

Ten things only someone who's built this before would know.

The difference between a generic consultant and someone who has built this before shows up in the details — data model patterns, regulatory context, the reports your board actually asks for. Here's what that looks like in practice.

01 Core banking systems use non-obvious business keys that differ from what the loan and share tables actually join on — getting this wrong causes silent fan-out at the fact level.
02 Core banking flat-file exports are SCD2 — every change produces a new row with validFrom, validTo, and a current-row flag. Resolving to current state must happen before any downstream join.
03 Consumer lending platforms often export application data as XML or semi-structured blobs, not clean relational tables. Parsing happens in the staging layer — not the source.
04 Mortgage servicing platforms keep daily balance snapshots per loan — 180 days × 600 loans = 108,000 rows. The join to dim_date on balance_date is what makes the delinquency trend chart work.
05 Mortgage origination platforms store GSE AUS results — Desktop Underwriter (Fannie Mae) and Loan Prospector (Freddie Mac) — separately from the underwriting decision. Both matter for secondary market reporting.
06 HMDA, TRID, ATR, and RESPA are the four regulatory frameworks that trigger compliance review in mortgage originations. These aren't just alert types — they each have distinct remediation workflows.
07 Credit union membership types — individual, joint, business, trust — drive product eligibility, rate tiers, and regulatory reporting. They belong in the member dimension, not derived at query time.
08 Employee members hold accounts with preferential rates set by the board. They require a separate reporting segment — not a filter, a named cohort with its own exception disclosure.
09 The roll rate matrix — accounts migrating Current → 30 → 60 → 90 → CO month over month — is the standard input for CECL loan loss reserve models under NCUA supervision. Every CRO knows this report by name.
10 Branch-level delinquency and charge-off reporting is a board-level requirement for NCUA-supervised institutions — not a nice-to-have dashboard, a compliance deliverable that goes to examiners.
Technical decisions

Why we chose what we chose.

Layer This POC Production equivalent Why the pattern holds either way
Warehouse Azure SQL (Basic) Snowflake · Databricks · Fabric · Synapse Cheapest Azure option at ~$5/mo proves the model works. Same dbt project runs against any warehouse with a one-line profile change — no model rewrites.
Transform dbt-sqlserver dbt Cloud · dbt Core on any warehouse Lineage graph, automated tests, and version-controlled models — the signal a credit union CTO needs to see regardless of the underlying engine.
Ingestion Azure Data Factory ADF · Glue · Fivetran · Airbyte ForEach pipeline loads 23 CSVs from Blob Storage — parameterized datasets, no per-table pipeline duplication. Same pattern scales to hundreds of source files.
Semi-structured parsing regexp_extract() PARSE_XML() · PARSE_JSON() · Spark schema inference Consumer lending platforms export blobs. Parsing in the staging layer — not the source — keeps raw data immutable and the transform logic auditable.
BI layer Metabase on ACI Power BI · Tableau · Sigma · Superset Dashboards sit on top of mart models — changing the BI tool never touches the warehouse. The mart layer is the contract.
Campaign analytics 3 mart models CRM integration · marketing automation Auto refi, cross-sell, and delinquency outreach targets built as dbt models — no separate tool needed. The warehouse becomes a revenue driver, not just a reporting tool.
SCD2 resolution isCurrentRow filter Same pattern — column names vary by platform Resolve to current state in int_member_current before any downstream join. Doing it at query time with a subselect causes fanout; doing it in a CTE costs one materialization.

Running systems that don't talk to each other?

We've built this warehouse pattern across Keystone, Jack Henry, MeridianLink, nCino, FICS, and more — on AWS, Azure, Snowflake, and Databricks. A specialist team handles data engineering, testing, and security review. We know the data, the regulatory context, and the three reports your board asks for every quarter. Let's talk.

Book a call